Trusted by state and local governments


Share slides from our call
Feel free to share a link to our product overview with your team or regional partners. Start a free trial when you are ready to kick the tires.
On-demand traffic diagnostics & reports
-
Automate traffic analysis
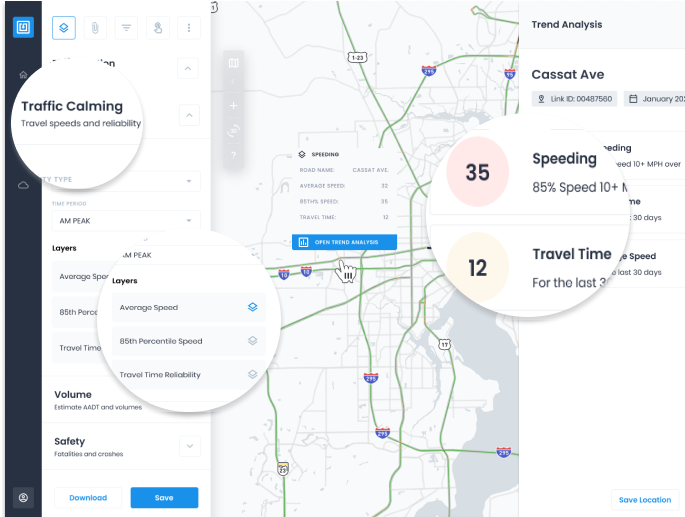
Automate traffic calming, travel delay, traffic safety and origin destination studies.
-
Traffic data on local roads
Daily connected vehicle data, refreshed monthly on every local road. Identify speeds, volumes, and delay.
-
Consolidate historical data & studies
Upload your traffic counts, speed studies and any GIS file to keep data in one place.

Quick setup
Start replacing manual traffic data collection and consulting fees in less than 14 days.
Easy to use
Easy to use online reporting tools give you access to critical traffic data and reporting on any road.
Instant results
Report speeding, safety, and congestion trends with daily traffic data refreshed monthly.
Traffic Data on Local Roads
Our traffic data enables cities to reduce manual data collection and analysis.
Speeding
Identify areas of concern with 85% Percentile, Freeflow, Peak Period, and Daily traffic speed aggregates.
Travel Delay
Identify congestion with travel time, reliability, and travel speeds on local road. Monitor trends every month.
Pedestrian Safety
Import crashes to identify crash rates and roadway level of stress for bike, pedestrian and non-motorists.
Data for ALL Local Roads
Get speed and volume data on all local roadways in your community.
Check out our 4.8 of 5 stars user reviews on G2
"Best Tool for Data Analysis! We highly recommend this tool for analyzing your data."
“Very timely service with an easy to use interface. Excellent response to issues and graphic display of data.”
“What you guys have done for performance measures and the dashboards looks the best out of everything [we] have seen”


